In April 2020, something unique happened when, for the first time, I saw Mount Kenya from Nairobi!
Certainly, I wasn’t the only one, as the sighting was so rare that even NPR covered the story. Many of us younger residents of Nairobi had never been able to view the peaks of Africa’s second largest mountain from Kenya’s capital city, notoriously known for its pollution, traffic, and noise. But after a month of a dusk-to-dawn curfew, international travel restrictions and limitations on travel in and out of Nairobi, the Mount Kenya sighting hinted at the possibility of one silver lining from Covid-19 constraints: Mother Earth could breathe again.
Carbon Emissions & Transportation
While carbon is essential for human, animal, and plant life on Earth, when carbon and oxygen atoms bond, they form carbon dioxide (CO2), a gaseous compound. This greenhouse gas gets easily trapped and absorbed in the layer of Earth’s atmosphere closest to us, called the troposphere, and then emits back to us. This cycle is among the greatest contributors to global climate change, perniciously affecting all life forms on Earth, and is “embedded in the very fabric of contemporary society,” according to Dr. Kate Ervine in her 2018 book titled Carbon.
Since it can be hard to imagine an invisible chemical element such as carbon, it may help to consider tangible effects, as demonstrated by the Mount Kenya example. At least 14% of greenhouse gas emissions comes from transportation – both industrial and individual travel.
In my SCA Sustainability Foundation course, I seek to link the three pillars of sustainability: social, economic, and environmental, for my students. One example I give pertains to coffee travel, since in the coffee world, we all travel for competitions, conferences, trade shows, festivals, origin trips, or even just for fun, to visit famous coffee shops in other places than where we live. As much as I love to travel, as time passes and climate change gets worse, I question how much of this travel is necessary, and if the negative impacts on our earth outweigh the benefits.
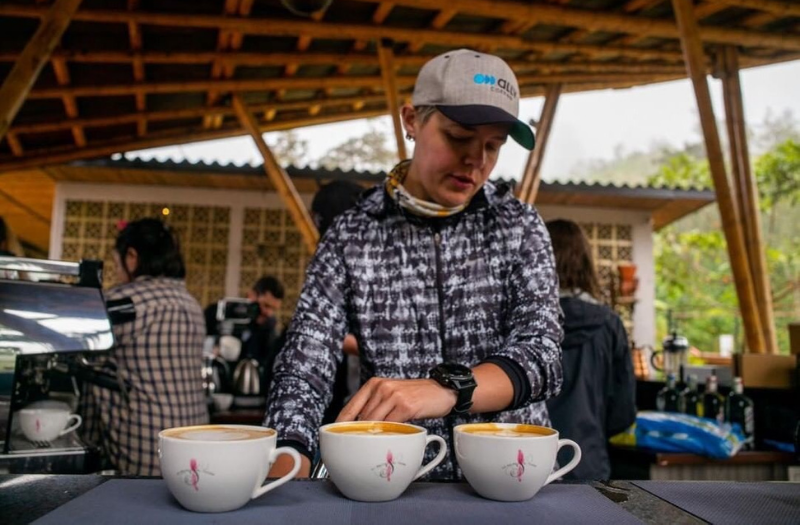
Inspiring Others: 2018 World Barista Champion Agnieszka Rojewska
After winning the WBC, Aga traveled more than any other year of her life. We decided that she would focus on one year of her air travel from June 2018 to June 2019. To calculate the carbon footprint of those travels, she used an online calculator that she discovered was among the most accurate, since it can even include transfer cities. From June 2018 till June 2019, Aga visited 28 different countries on 35 trips, leading to a total of 154 flights taken.
Together, all these flights resulted in an estimated carbon footprint of 194,52 metric tons of CO2 for her air travel alone, a number that doesn’t include trains, cars, taxis, or other modes of travel when she arrived to each destination or while she was there. To put this number in perspective, Aga compared it with the average yearly footprint of the citizens of from our classmates’ home countries. She learned that 194,52 metric tons is more than the yearly average of the total carbon footprint for 13 Canadians, 13 Americans, 22 Poles, 26 South Africans, 54 Mexicans, 102 Indonesians, and 589 Kenyans.
In her final analysis, Aga realized that she could have meaningful impact on environmental sustainability by spending more time in the future to plan her travel and choose more sustainable behaviors. In doing so, Aga says, “sustainability is not just a word that I hear a lot during conferences but is an action that can lead us beyond just awareness and knowledge.” She told me that she hopes her project can provide others with “some tools or guidelines how to put thinking into doing.”
Winston Thomas of South Africa
His flights included Cape Town to King Shaka (Durban), King Shaka (Durban) to Lanseria (Johannesburg), and Tambo (Johannesburg) back to Cape Town. Bus trips included Park Station (Johannesburg) to Bloemfontein and Bloemfontein to Centurion. Cars and Uber were used to travel from airports to cafes and back. This single one-week trip resulted in a carbon footprint of 0.53 metric tons of CO2, while the average total carbon footprint in South Africa, per person for a year, is less than 9 metric tons.
As a freelance coffee professional and AST for the Specialty Coffee Association, Winston looks back as this trip as a great experience for him and the South African coffee community. But analyzing the carbon footprint of the travel led him to recognize that “with more planning and time, it might have been better to do the complete trip by car. That would have saved on carbon emissions and cost, although it would have taken a lot more travel time and energy.” Winston told me that the carbon exercise challenged him to be more “conscious of the three pillars of sustainability at all times. In the trip, I focused on the social and economic elements, but all this to the detriment of environment. While an individual’s carbon footprint cannot be completely erased, it is something that, with more thought and planning, can be reduced.”
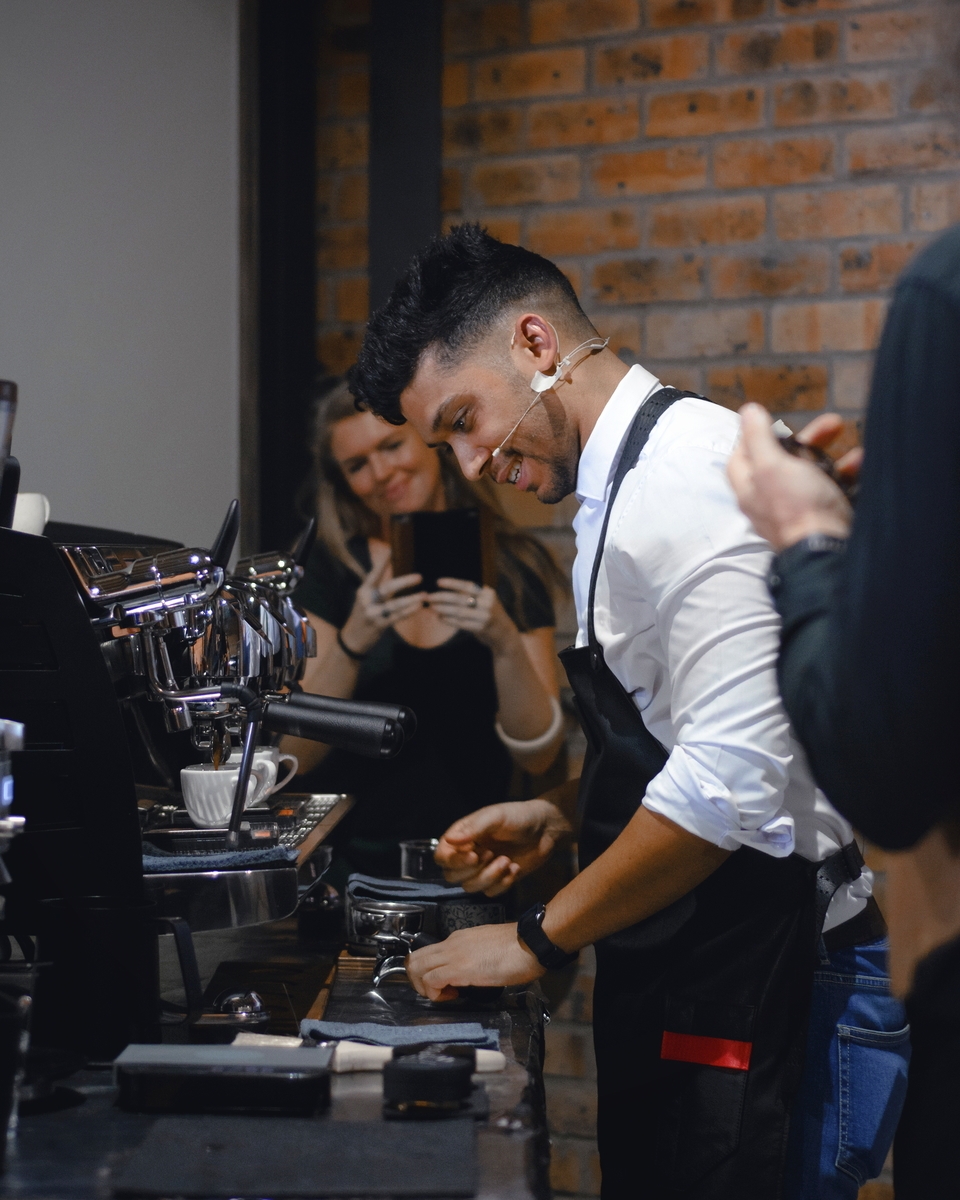
Mikael Jasin of Indonesia
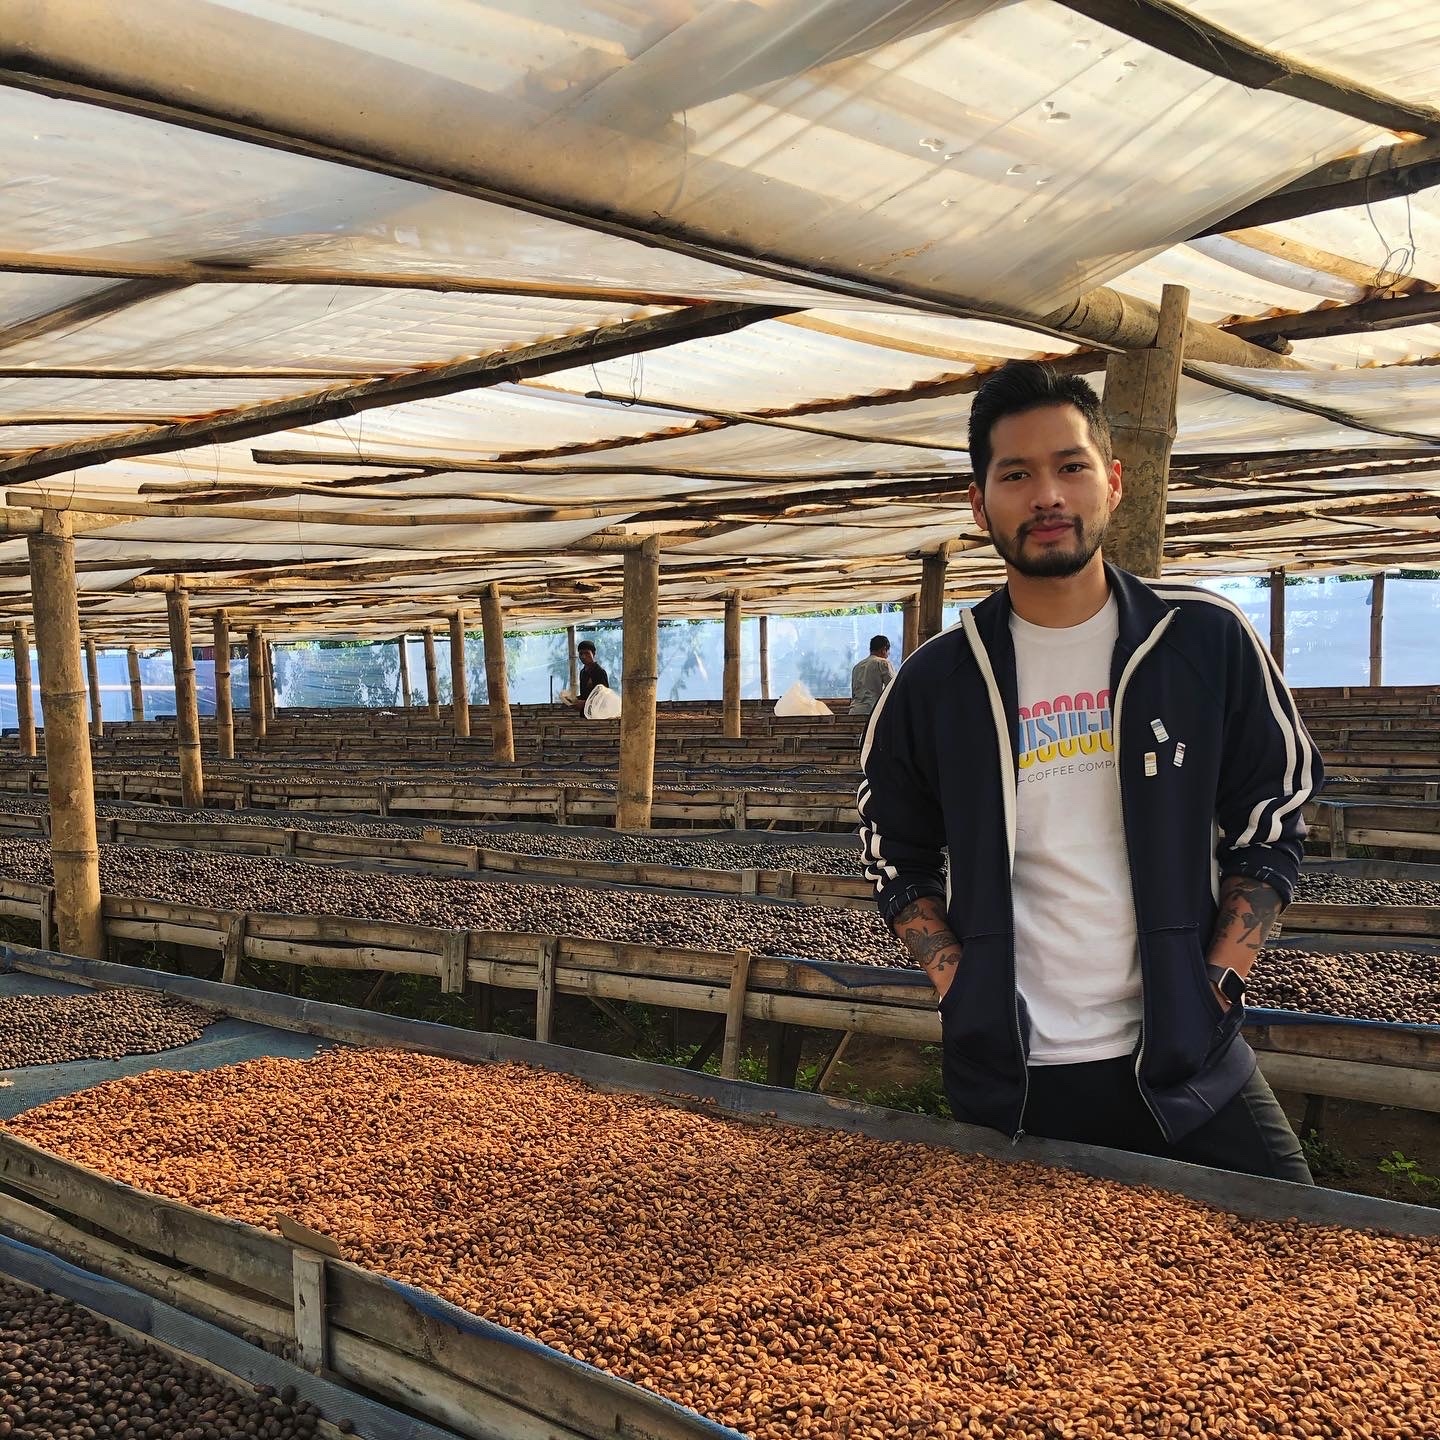
Mikael was surprised to learn this, noting that planning ahead in the future would be one way to reduce his carbon footprint through his essential business travel. He shared that “it was very easy to calculate his carbon footprint through the calculator and it’s pretty detailed, down to the make and year of your car.” Doing so helped Mikael realize one concrete way our individual choices can make a difference.
The Carbon Inequality Era
Such inequities are highlighted from a different perspective in new report by researchers at the Stockholm Environment Institute and Oxfam International, which demonstrates that from 1990 to 2015, annual global carbon emissions grew by 60%, or double the amount of cumulative emissions. Most of these emissions come from the Global North, leading to an increasingly negative climate impacts for the Global South. As this September 2018 data analyzes, the richest 1% globally are responsibility for more than double the carbon emissions of the poorest half of humanity (page 8), leading the report to identify our current time as the Carbon Inequality Era.
Concluding Thoughts
If COVID-19 has taught us anything, it may be that some travel is unnecessary, some meetings can be video calls, and more business can be conducted through email. Addressing and improving sustainability will do more than allowing forgotten images such as the view of Mt. Kenya from Nairobi. Our specialty coffee community might consider if, even after all COVID-19 travel restrictions are lifted, the collective impact of the travel required, encouraged, or desired to succeed in this industry might be working against long-term sustainability both for the seeds and human actors who make coffee possible.
Sources & Recommended Further Reading
Kartha, S., Kemp-Benedict, E., Ghosh, E., Nazareth, A. and Gore, T. (2020). The Carbon Inequality Era: An assessment of the global distribution of consumption emissions among individuals from 1990 to 2015 and beyond. Joint Research Report. Stockholm Environment Institute and Oxfam International.